“No challenge poses a greater threat to future generations than climate change,” said President Barack Obama in his State of the Union address back in 2015, and this is certainly true in the wind industry. Researchers from University of Colorado at Boulder have just published a new study in Nature Geoscience showing that there may be a global north-to-south shift in wind energy resources by the end of the century, which could give wind planners a headache moving forward.
Members of the Cooperative Institute for Research in Environmental Sciences and Renewable and Sustainable Energy Institute at the University of Colorado at Boulder foresee wind resources declining in the northern hemisphere, with a sharp increase in several hotspot regions in the southern half of the planet.
“There’s been a lot of research looking at the potential climate impact of energy production transformations – like shifting away from fossil fuels toward renewables,” says lead author Kris Karnauskas, CIRES Fellow and Assistant Professor in Atmospheric and Oceanic Sciences (ATOC). “But not as much focuses on the impact of climate change on energy production by weather-dependent renewables, like wind energy.”
As installed wind capacity grows at 20% per annum, Karnauskas and his colleagues at ATOC wanted to better understand likely shifts in production, so they turned to an international set of climate model outputs to assess changes in wind energy resources across the globe. The team then used a “power curve” from the wind energy industry to convert predictions of global winds, density and temperature into an estimate of wind energy production potential.
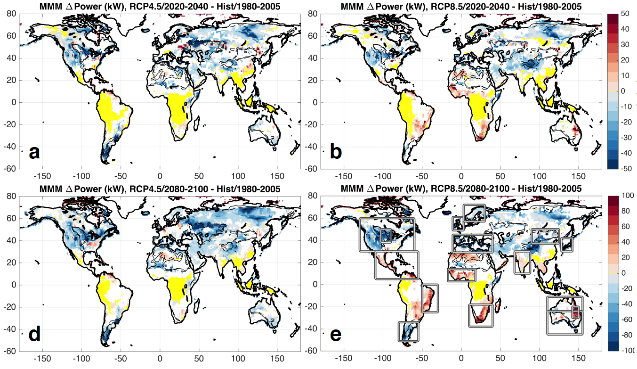
The results of their analysis point towards a pronounced asymmetry in wind power potential across the globe. If carbon dioxide emissions continue at high levels, wind power resources may decline in the northern hemisphere’s mid-latitudes, and rise in the southern hemisphere and tropics by 2100.
Strangely, the team also found that if emission levels are mitigated – dropping lower in coming decades – indications are that wind power will reduce in the north but may not be countered with an increase of power in the south.
Looking at specific geographies, the researchers highlight that areas with consistently strong winds today, for example the prairies of the American Midwest, may see wind resources falling significantly by the end of the century as warmer temperatures at the North Pole weaken the temperature difference between this cold region and the warm equator: a smaller temperature gradient means slower winds in the northern mid-latitudes. “These decreases occur primarily during the winter season, when those temperature gradients should be strong and drive strong winds,” explains co-author of the research, Julie Lundquist. In addition to North America, the team identified possible wind power reductions in Japan, Mongolia and the Mediterranean.
In contrast, potential wind energy production in the southern hemisphere, such as in northeastern Australia, could see dramatic rises in wind resource. Where there is more ocean than land, a different kind of gradient increases: land warms faster than the surrounding, much-larger oceans, fueling stronger winds. Hotspots for likely wind power increases also include: Brazil, West Africa, South Africa and Australia.
Despite these findings, Karnauskas warns that the results for certain regions are not clear-cut with some models forecasting more wind, and others, less. “Europe is a big question mark,” he says. “We have no idea what we’ll see there. That’s almost scary, given that Europe is producing a lot of wind energy already.”
The Central United States and Inner Mongolia are other areas of uncertainty. “We need to use different tools to try to forecast the future – this global study gives us a roadmap for where we should focus next with higher-resolution tools,” concludes Lundquist.
Image note: Top images represent next 40 years, bottom images represent next 80 years. Left images represent lower emissions, right images represent higher emissions scenario. Red areas are wind power hotspots, blue areas are reductions. White areas are uncertain. Source: Kris Karnauskas/CIRE
No Comment